
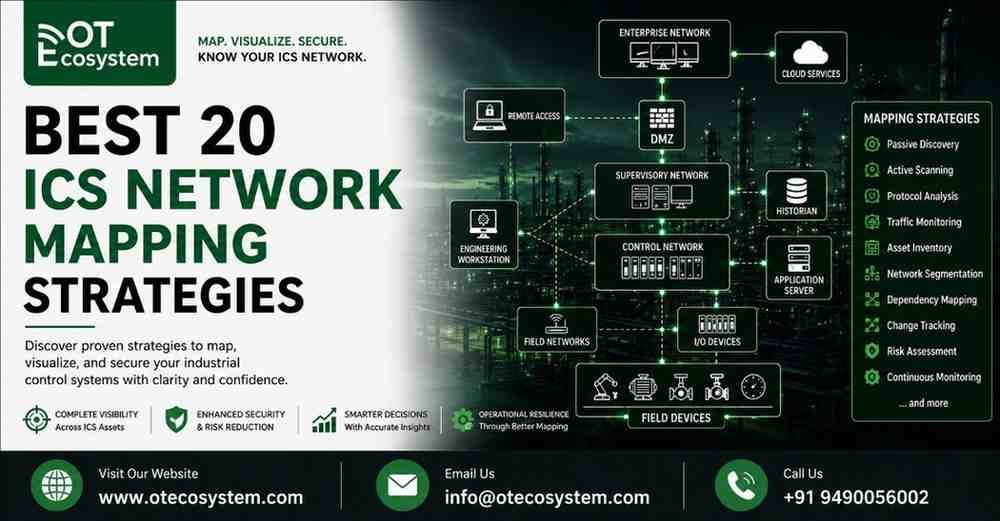
The Evolution of ICS Network Mapping: Background
For decades, Operational Technology (OT) and Industrial Control Systems (ICS) operated behind the protective shroud of physical air-gaps. Facilities relied on static documentation, paper schematics, and isolated network segments to maintain operational integrity. However, the rapid acceleration of Industry 4.0, smart manufacturing, IIoT deployments, and remote predictive maintenance has permanently erased the traditional perimeter. Enterprise IT networks, cloud-based historians, and third-party vendor connections now directly interface with plant-floor machinery, creating complex, interconnected digital ecosystems where an unknown asset represents an unmanaged cyber-physical risk.
In modern industrial environments, you cannot defend what you cannot see. Yet, mapping an ICS network is fundamentally different from scanning a corporate IT network. Traditional active ping sweeps, port scans, and aggressive automated enumeration tools designed for enterprise IT can cause legacy Programmable Logic Controllers (PLCs), Remote Terminal Units (RTUs), and sensitive Human-Machine Interfaces (HMIs) to crash, lock up, or enter unrecoverable fault states. Such disruptions can halt continuous manufacturing lines, cause physical equipment damage, or compromise safety instrumented loops.
Consequently, ICS network mapping requires a specialized, multi-dimensional discipline. It combines non-intrusive passive monitoring, protocol-aware active querying, physical cabinet audits, and configuration file parsing to render complete, real-time visibility. By mapping not just IP addresses, but also protocol function codes, inter-device communication dependencies, and Purdue Model layer boundaries, OT security teams can construct a defensible architecture that stops lateral movement and preserves physical safety.
Best 20 ICS Network Mapping Strategies
1. Deploy Passive OT-Aware Traffic Sniffing via TAPs and SPAN Ports
Passive network monitoring is the golden rule of industrial asset discovery because it places zero overhead on delicate control devices. By connecting dedicated OT-aware network sensors to optical Network TAPs or switch SPAN/MIRROR ports at critical choke points, security engines silently ingest copy-traffic without transmitting a single frame over the wire. These sensors inspect deep packet payloads across specialized protocols-such as Modbus TCP, EtherNet/IP, DNP3, and Siemens S7 communication-to identify MAC addresses, IP addresses, firmware versions, and active operating states. Passive sniffing constructs a foundational baseline of operational traffic while guaranteeing that real-time physical loops remain completely unperturbed.
2. Implement Non-Disruptive Native Active Querying
While passive monitoring captures actively communicating nodes, it can miss silent backup controllers, dormant RTUs, or infrequently polled field assets. To discover these hidden nodes without risking operational disruption, security teams should deploy non-disruptive, OT-aware active querying. Unlike generic ICMP or Nmap port scans, native industrial querying crafts precise, single-packet requests using the exact proprietary dialect designed for the target asset-such as CIP identity requests or SNMP read-only community strings. Communicating strictly within vendor-approved specifications extracts granular device metadata, configuration details, and backplane slot layouts safely without triggering CPU starvation or controller lockups.
3. Align Network Topology Maps with ISA/IEC 62443 Zones and Conduits
An effective network map must represent logical operational boundaries rather than just a flat list of connected IP addresses. Aligning your network visualization with the ISA/IEC 62443 standard involves grouping physical and cyber assets into distinct “Security Zones” based on functional criticality, operational impact, and risk profiles. The communication pathways that link these zones are designated as “Conduits,” where strict access control policies and deep packet inspection rules are enforced. Mapping assets into zones and conduits allows security analysts to quickly identify segmentation drift, detect unauthorized cross-zone routing, and enforce least-privilege traffic flows across the Purdue Model.
4. Parse PLC and DCS Backup Configuration Files (Offline Discovery)
When physical, air-gapped network segments cannot accommodate network sensors or active probes, offline configuration parsing offers a powerful alternative. Industrial engineering software-such as Rockwell Studio 5000, Siemens TIA Portal, or Schneider Electric EcoStruxure-generates detailed project configuration files and logic backups containing complete hardware definitions. Ingesting these vendor project files into OT asset management platforms parses logic trees, module sub-rack layouts, configured IP addresses, remote I/O bindings, and variable registers. This offline parsing strategy renders precise sub-surface visibility into deeply nested rack components and isolated sub-networks without sending a byte across the wire.
5. Map Serial-to-Ethernet Converters and Legacy Fieldbus Topologies
A significant portion of critical infrastructure still relies on legacy serial communication protocols like Modbus RTU, Profibus, and DNP3 serial running over RS-485 or RS-232 links. These fieldbus networks connect to modern Ethernet backbones via serial-to-Ethernet gateways and terminal servers. Network mapping strategies must explicitly trace these conversion gateways to map the serial sub-tier devices hiding behind single IP endpoints. Inspecting gateway translation tables and serial frame headers allows analysts to map every attached slave RTU, meter, and actuator, preventing dangerous blind spots at the physical edge of the control loop.
6. Ingest Switch MAC Address Tables and Router ARP Caches
To build an accurate L2/L3 physical topology map, security teams should programmatically poll managed industrial network switches and routers. Extracting MAC address forwarding tables (CAM tables), ARP caches, and VLAN configurations via SSH or SNMP read-only queries reveals the exact physical switch port to which every HMI, PLC, and engineering workstation is connected. Correlating port-level data with network flow analytics identifies unmanaged unmanaged switches, unauthorized physical drop-box hardware, or rogue hardware taps plugged directly into cabinet switch ports, ensuring complete physical layer accountability across the facility.
7. Conduct Physical Cabinet Audits and Nameplate Inventory Validation
Digital discovery tools must always be validated against the physical reality on the plant floor. Conducting structured physical panel walk-throughs allows engineers to inspect PLC racks, power supplies, edge gateways, and physical cabling directly inside control cabinets. Verifying hardware serial numbers, vendor nameplates, model numbers, and physical slot occupations catches unnetworked spare components, legacy expansion cards, and physical modifications that digital scans might miss. Reconciling physical audit data with digital network maps establishes an authoritative asset baseline that supports regulatory compliance and lifecycle management.
8. Map Wireless, Cellular, and IIoT Radio Frequency (RF) Assets
Modern industrial plants deploy a vast array of wireless field instruments, including WirelessHART sensors, ISA100.11a transmitters, industrial Wi-Fi networks, private 5G nodes, and Bluetooth Low Energy (BLE) calibration tools. Traditional wired network sensors cannot detect native radio frequency emissions. Incorporating spectrum analyzers, wireless intrusion detection sensors (WIDS), and RF mapping tools into your inventory process identifies wireless access points, field gateways, and cellular IoT modems. Mapping the RF spectrum exposes rogue wireless bridges and signal leakage that extends beyond physical perimeter fences.
9. Track Transient Cyber Assets and Engineering Laptops
Transient cyber assets-such as field technician laptops, contractor diagnostic tablets, and portable USB calibration tools-frequently connect to isolated control networks during maintenance windows. Because these devices move dynamically between untrusted corporate or home networks and isolated OT zones, they represent primary infection vectors for lateral movement. Implementing specialized transient asset tracking mechanisms logs MAC addresses, device hostnames, software inventories, and connection timestamps whenever a diagnostic tool plugs into a cabinet port. Mapping transient connections ensures full auditability during forensic investigations and maintenance events.
10. Analyze Industrial Protocol Function Codes and Register Profiles
True ICS network mapping goes beyond cataloging device identities; it requires mapping data flows down to the application layer payload. Advanced OT monitoring platforms inspect protocol payloads to record specific function codes (such as Modbus Function Code 5 for single coil writes or Function Code 8 for diagnostics) and targeted register addresses. Mapping which supervisory hosts issue read queries versus write commands or logic updates creates a functional communications map. This operational visibility allows security teams to flag abnormal control actions, such as an HMI attempting to flash controller firmware.
11. Establish Dynamic Behavioral Baselines and Communication Graphs
Industrial operations are highly deterministic, exhibiting cyclic, highly predictable communication patterns between master devices and field slaves. Utilizing Machine Learning (ML) and behavioral analytics engines allows security teams to model these baseline interaction patterns over multi-week operational cycles. The resulting communication graph visually maps legitimate talker-listener pairs, polling frequencies, packet payload sizes, and bandwidth consumption. Once established, any deviation from the baseline-such as a field RTU suddenly initiating an outbound connection to an external address-instantly triggers an anomaly alert.
12. Integrate OT Asset Data with Centralized CMDB, SIEM, and SOAR
An isolated network map rapidly becomes outdated if it remains siloed within a standalone security tool. To maintain operational value, ICS network mapping platforms must continuously export asset metadata, topology changes, and vulnerability findings to enterprise Configuration Management Databases (CMDBs), Security Information and Event Management (SIEM) systems, and SOC dashboards. Automated API integration enriches SOC security alerts with physical process context, such as device criticality, location, and operational function. This unified visibility enables IT and OT teams to collaborate efficiently during incident response and patch management workflows.
13. Map East-West Inter-Controller (PLC-to-PLC) Peer Communications
In complex automated manufacturing and processing facilities, controllers frequently communicate directly with one another across the horizontal plane without supervisory HMI intervention. These peer-to-peer East-West communications-such as safety interlocking signals passed between PLCs via Producer/Consumer CIP or Siemens S7 links-are essential for real-time process coordination. Network mapping strategies must explicitly capture and document these inter-controller dependencies. Identifying horizontal communication pathways prevents engineers from accidentally severing critical process interlocks during network maintenance or micro-segmentation rollouts.
14. Identify Dual-Homed Systems and Multi-NIC Bridging Nodes
Dual-homed hosts-devices configured with multiple network interface cards (NICs) connected to different subnets-are among the most dangerous architectural risks in OT environments. A supervisory server, historian, or engineering station attached simultaneously to both an enterprise IT network and a plant control network can act as an unmonitored bridge, effectively bypassing perimeter firewalls. Network mapping tools must analyze host routing tables, IP configurations, and dual-NIC connections to flag dual-homed devices immediately, ensuring that no unauthorized multihomed bridges bypass defined Purdue Model boundaries.
15. Map Safety Instrumented Systems (SIS) Boundary Isolations
Safety Instrumented Systems (SIS)-such as Triconex, ProSafe, or HIMA safety logic solvers-are designed to bring industrial processes to a safe shutdown during hazardous conditions. Because an SIS compromise risks human life and severe environmental damage, these systems must remain isolated from basic process control systems (BPCS). Mapping strategies must explicitly verify the air-gapped or strictly unidirectional boundaries surrounding SIS networks. Mapping software must flag any unauthorized direct connection, engineering tool session, or routing path attempting to cross into the safety layer.
16. Inspect Encrypted and Tunnelled Protocol Payloads
As modern industrial vendors incorporate cryptographic security standards-such as OPC UA with Security Profiles, CIP Security, and DNP3 Secure Authentication-traditional plaintext payload inspection becomes challenging. Furthermore, adversaries may attempt to tunnel unauthorized traffic inside permitted industrial port wrappers. Advanced mapping strategies combine SSL/TLS certificate auditing, key management integration, and inner-header metadata inspection to map encrypted sessions. Validating cryptographic certificates, cipher suites, and endpoint identities guarantees that encrypted channels remain transparent to security mapping engines while preserving privacy.
17. Audit Remote Access Pathways and Vendor Telemetry Tunnels
Third-party original equipment manufacturers (OEMs), integrators, and maintenance vendors frequently establish remote access tunnels into plant networks to provide emergency troubleshooting and predictive support. Network mapping programs must comprehensively identify all incoming remote access entry points, including cellular modems, satellite gateways, VPN endpoints, and jump hosts. Mapping these external ingress points ensures that remote connections land strictly within an Industrial DMZ (iDMZ) and undergo strict authentication, session recording, and least-privilege access control before reaching field assets.
18. Classify Assets using Function-Based and Consequence-Driven Taxonomies
A simple list of IP addresses offers limited value during an operational crisis unless assets are categorized by their physical consequences. Network mapping platforms should classify assets using a standardized taxonomy based on operational function (e.g., HMI, PLC, SIS, Historian, VFD) and consequence-driven risk ratings. Categorizing devices according to process criticality-such as assigning high-consequence ratings to primary boiler controls versus low-consequence ratings to environmental monitoring sensors-allows security teams to prioritize vulnerability remediation, patch schedules, and threat detection responses effectively.
19. Automate Real-Time Network Topology Map Generation
Static network diagrams created in Visio or stored on CAD drawings become obsolete the moment a technician replaces a switch or adds a field transmitter. Security operations require automated, dynamic network mapping tools that generate interactive, real-time topology views. These dynamic maps display live communication links, VLAN layouts, Purdue Model tiers, and operational health statuses automatically. Interactive mapping software allows defenders to filter views by protocol, zone, or risk severity, drastically shortening the time required to investigate anomalies during incident response.
20. Conduct Regular Delta Analysis to Detect Shadow Devices and Drift
The final element of a mature ICS network mapping strategy is continuous delta analysis-comparing current network maps against established baseline configurations. Automated tracking engines continuously monitor the environment for network drift, flagging new MAC addresses, unauthorized IP changes, unapproved port openings, or altered communication pathways in real time. Instant notification of shadow IT/OT devices, rogue access points, or modified controller configurations empowers plant security teams to investigate and isolate unauthorized assets before they can be exploited.
Conclusion: Elevating Industrial Resilience Through Comprehensive Visibility
Securing modern Operational Technology environments begins and ends with actionable, continuous network mapping. As cyber threats targeting critical infrastructure become increasingly sophisticated, relying on manual inventories, outdated paper schematics, or perimeter-only defenses introduces unsustainable risk.
By deploying a multi-layered mapping strategy-combining non-intrusive passive monitoring, native active querying, ISA/IEC 62443 zone mapping, and automated delta analysis-organizations build a complete, real-time visual model of their control ecosystem. Achieving deep visibility across every layer of the Purdue Model empowers security teams to enforce micro-segmentation, detect subtle protocol anomalies early, accelerate incident response, and safeguard continuous physical operations against evolving cyber threats.